Where did my flash go? Visualizing linker statistics
This post was originally published on Mbed Developer Blog.
It happens to all of us. At some point, your application compiles, but the linker fails with a message similar to '.data' will not fit in region RAM’`. This is a sign that the application does not fit in flash, something that is limited on most microcontrollers. Flash memory takes up a lot of silicon area (In this picture of an ST Cortex-M3, the 128K of flash is in red), and therefore increases both the cost and the likelihood of defects in microcontrollers. Flash also requires power, and more flash increases power consumption. Less flash is better for cost and energy efficiency, but it can be a nuisance when writing applications.
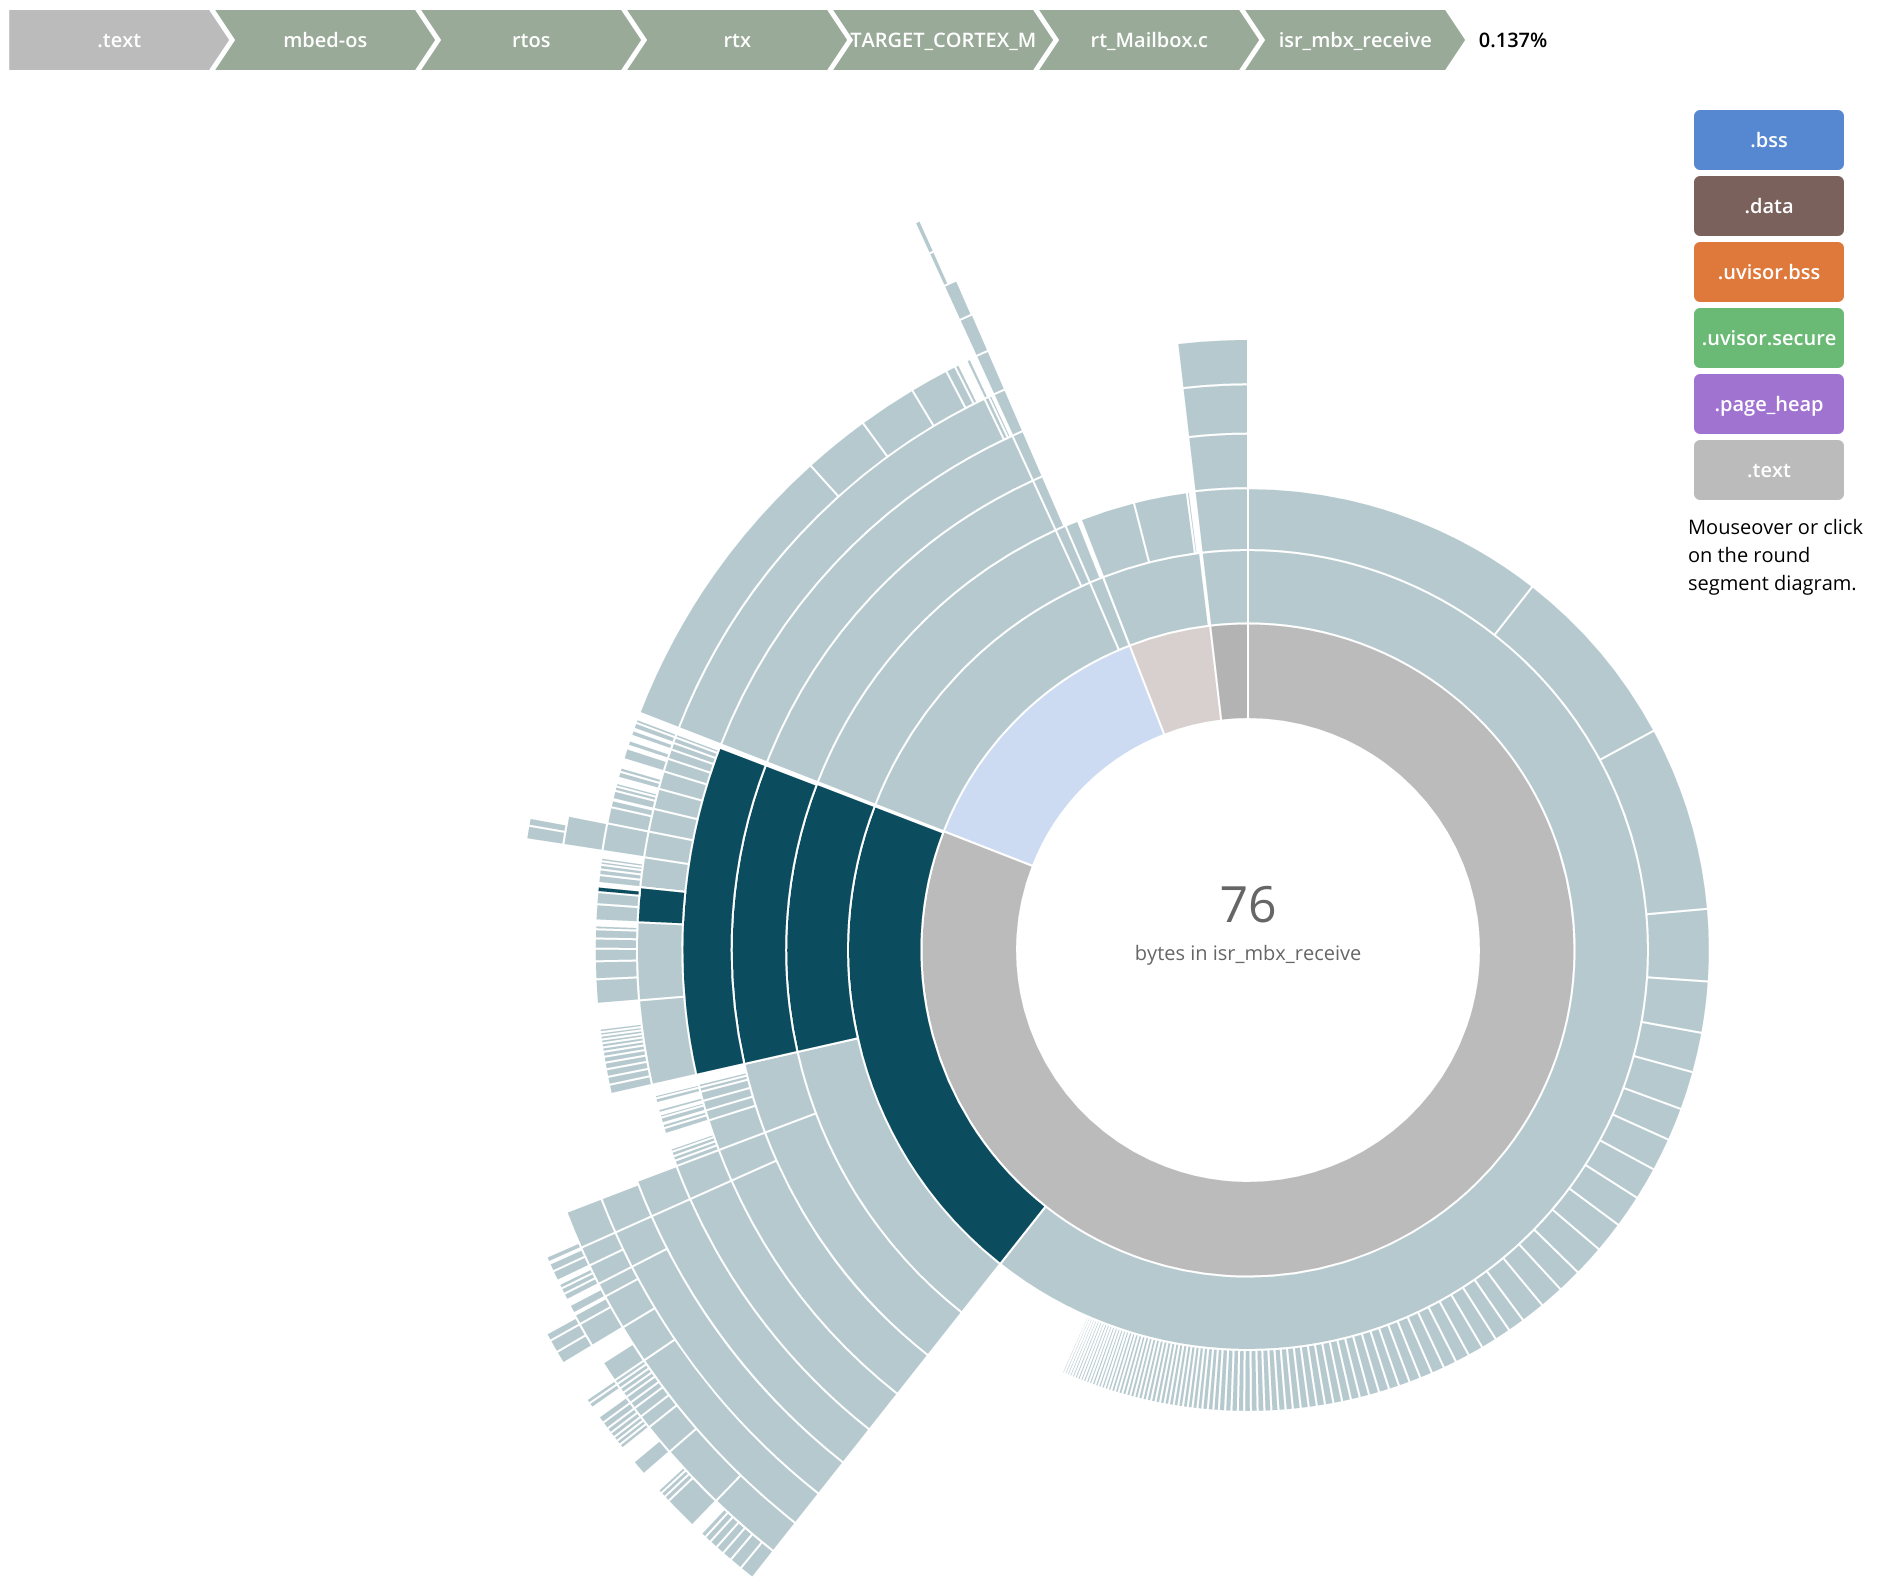
To find out what filled that precious flash, you can dissect the .elf file in your build folder, but it’s a tedious task. To make this process easier, Milosch Meriac - security expert at Arm and the author of uVisor - wrote mbed-os-linker-report. This small tool creates a visualization of linker statistics for Arm Mbed OS 5.

Visualization of flash usage of an Mbed OS 5 program
Instructions on how to use the tool are on GitHub, and a live demo is available here.
If you’re interested in making your application use less flash, read the blog posts on optimizing flash memory usage and on tuning the parameters of Mbed’s RTOS.
-
Jan Jongboom is Developer Evangelist IoT at Arm, and he values his flash memory.